

My first Clustering - K-means


I talked here, about how I found this data that could provide insights on edge server placements, service migration etc.
I obviously needed to use a clustering algorithm on the data to get a sense of the intuition behind why its deemed to contain insights on edge server placements, service migration etc. And being a noob, I wanted to start from the absolute scratch. so I decided on a partitioning clustering algorithm, ergo --> k-means.
I cleaned the data to now have only 4 features from which I ended up using only 2 for my first clustering algorithm.
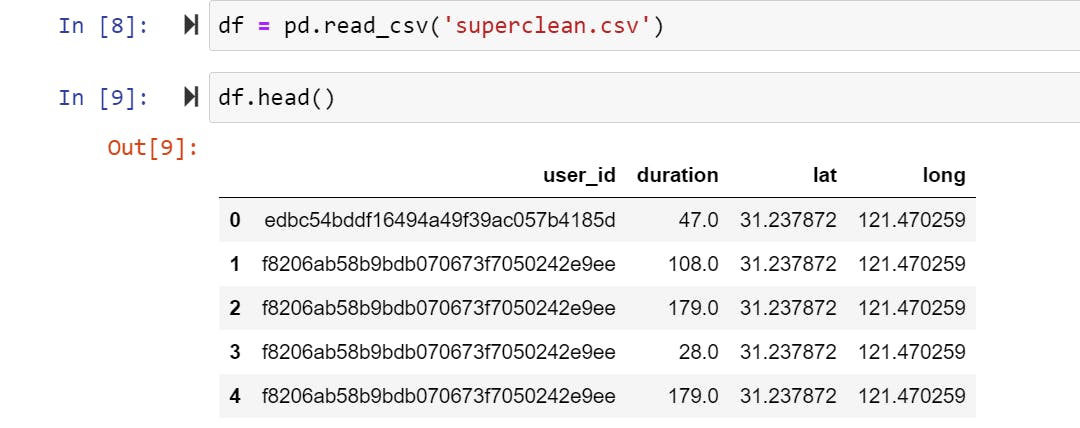
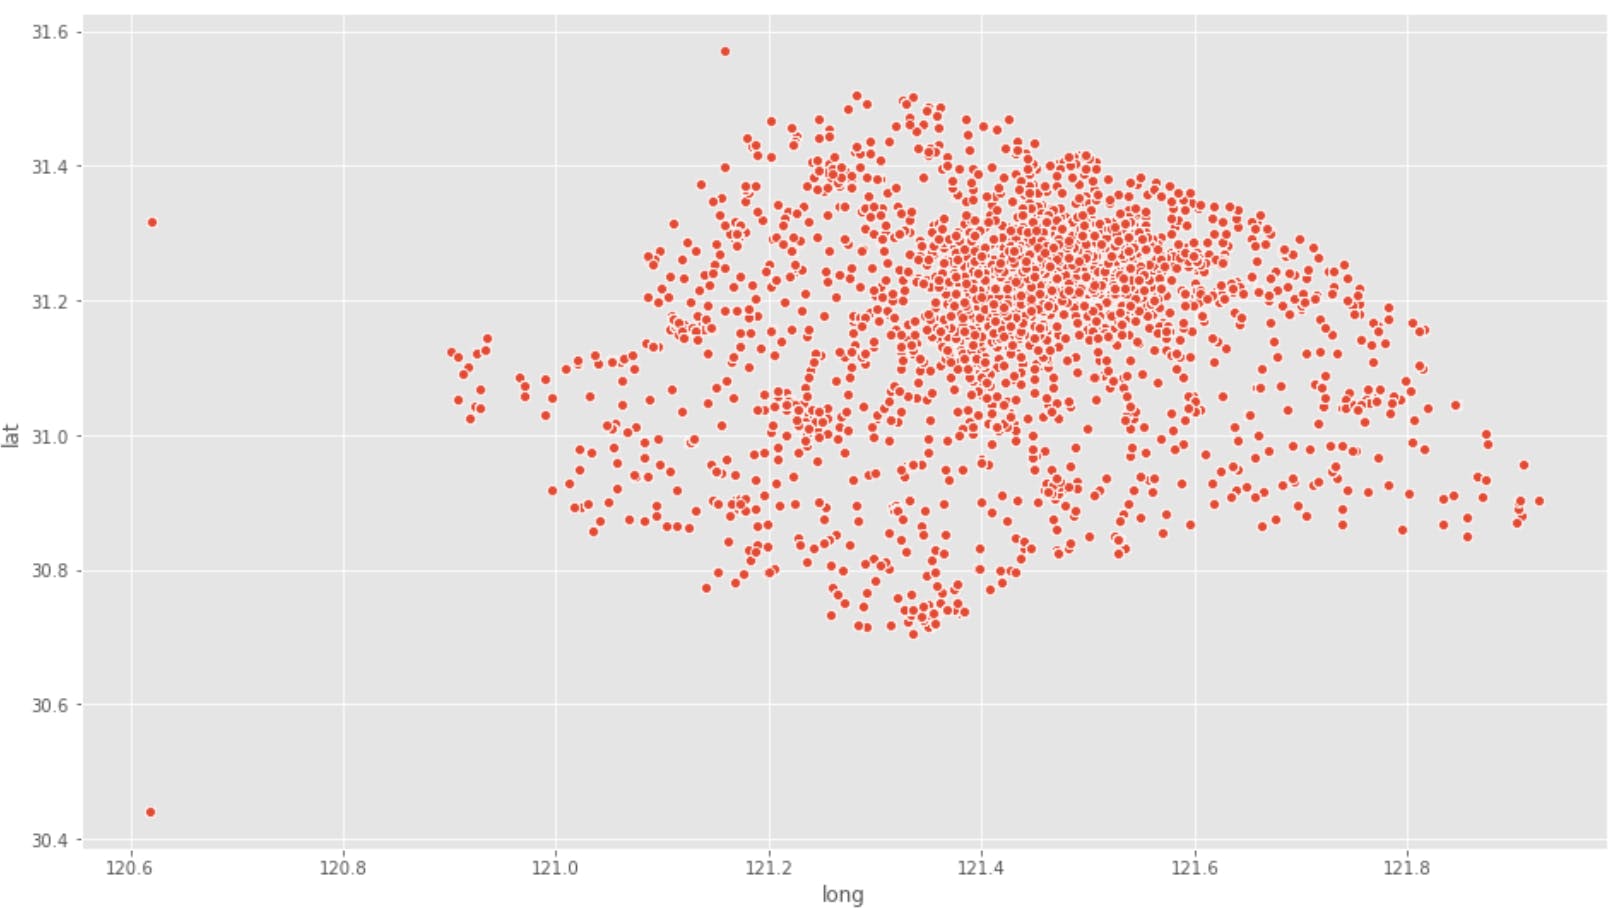
plotting the data and removing outliers provided me with the graph below:
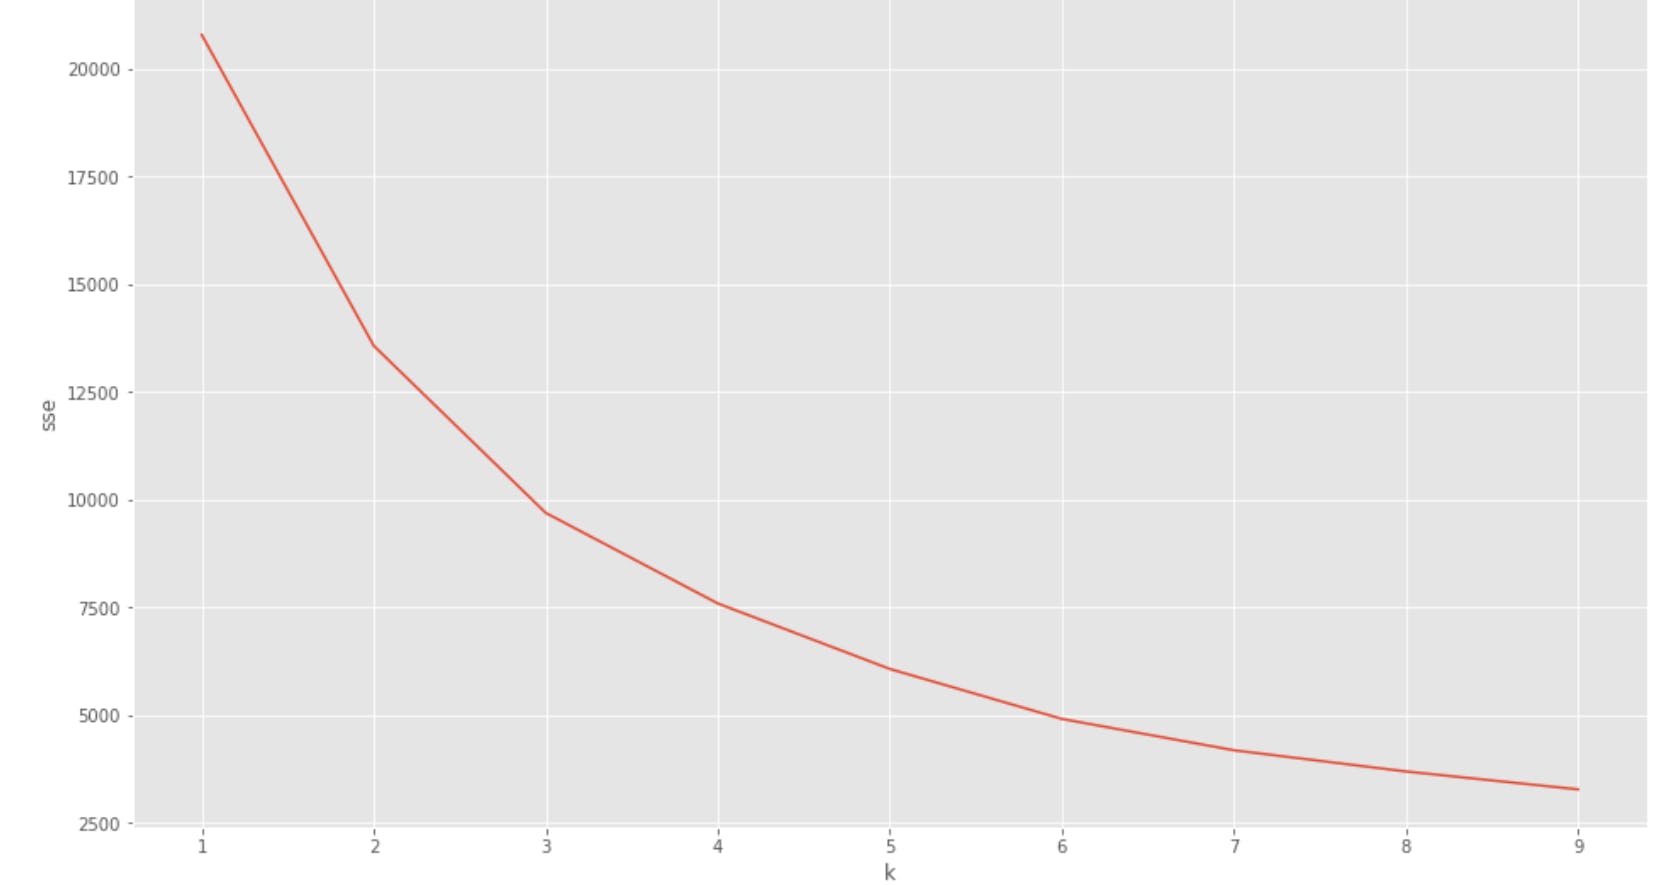
Then I determined the optimum value of k using scikitlearns inbuilt Kmeans module.
k_rng = range(1,10)
sse = []
for k in k_rng:
    km = KMeans(n_clusters=k)
    km.fit(df[['long', 'lat']])
    sse.append(km.inertia_)
Then I plotted the sum of squared errors(sse)(or within cluster sum of squares(wss)) against the range of k values to obtain the following graph. This way of determining k is called the elbow method
Now to the K-means itself
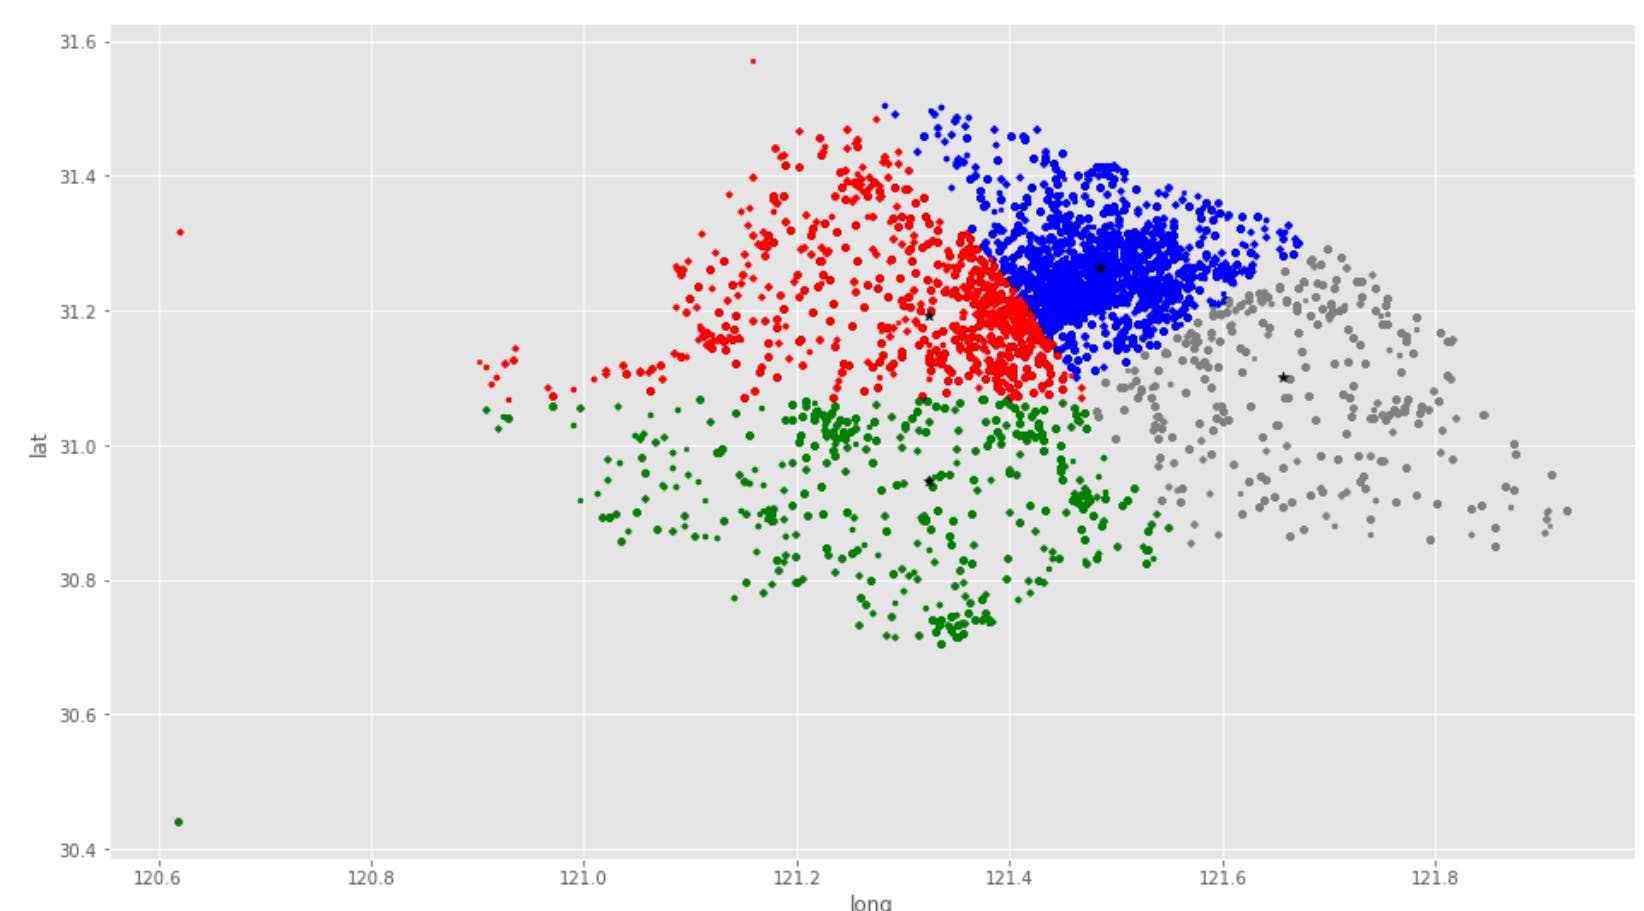
I decided to use a k value of 4. Again, using the scikitlearn library:
km = KMeans(n_clusters=4)
y_predicted = km.fit_predict(df[['long','lat']])
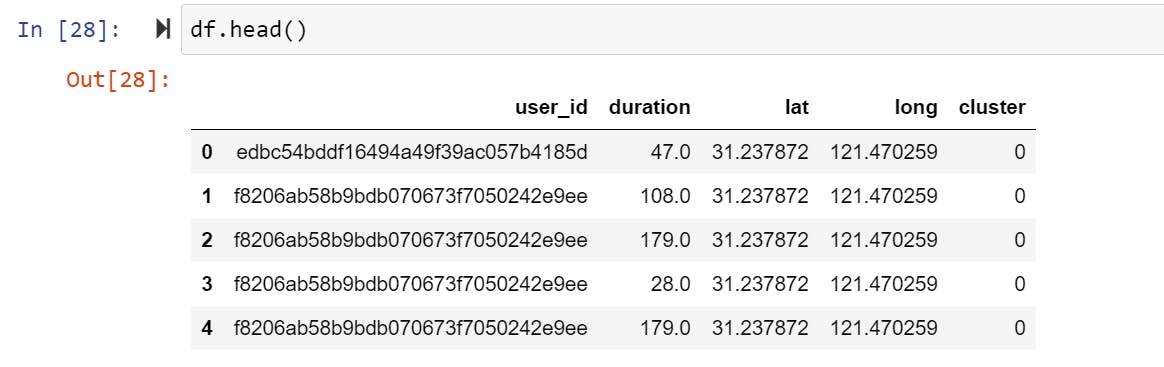
df['cluster'] = y_predicted
So I created a new feature "clusters" which maps each datapoint to its cluster.
Then I identified my clusters and cluster centers:
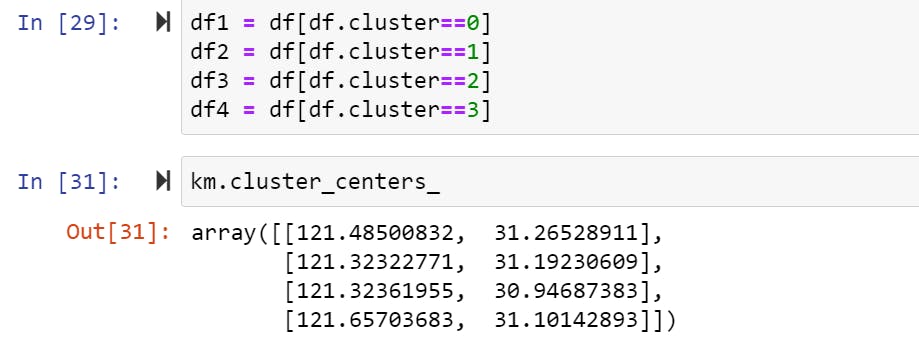
Then plotted:
the code is available here
👩🏾🚀decided to start my dl journey in parallel with my ml journey. so I've been abit distracted. implementing the kmeans algo from scratch in a bit(where the math behind all of the above will be explained in-depth). excited to do knn, decision trees and random forests next
sources:
codebasics youtube channel
simplilearn youtube channel